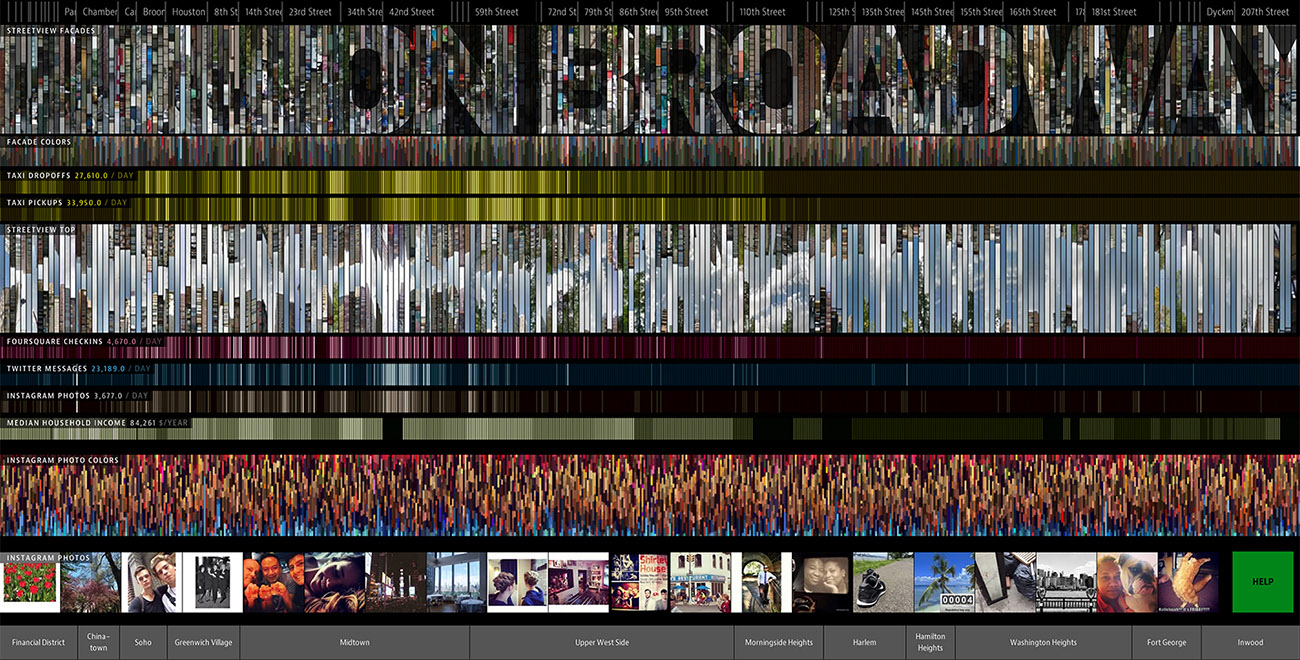
On Broadway
A new type of city view that utilizes the linear narrative of a single street to represent digital life in the 21st century city.
Over the last few years, swift advances in data collection have led to a wealth of available datasets.
Given the sheer pervasiveness of tracking, sensing, and collecting, how can we develop new tools and approaches that encourage exploration and, most importantly, new ways of 'making sense of data'?
Unlike contemporary map-based urban visualizations, ‘On Broadway’ takes a novel approach to representing digital life in the 21st century city. In a linear, non-map based interface, this particular visualization opts for a compilation of images and other data collected along the 13 miles of Broadway, covering the entire length of Manhattan.
'On Broadway' proposes a new visual metaphor for thinking about the city: a vertical stack of image and data layers juxtaposing the different data to highlight new connections, correlations and contexts.
'On Broadway' was directly inspired by a landmark work of art: Every Building on Sunset Strip by Edward Ruscha (1966).
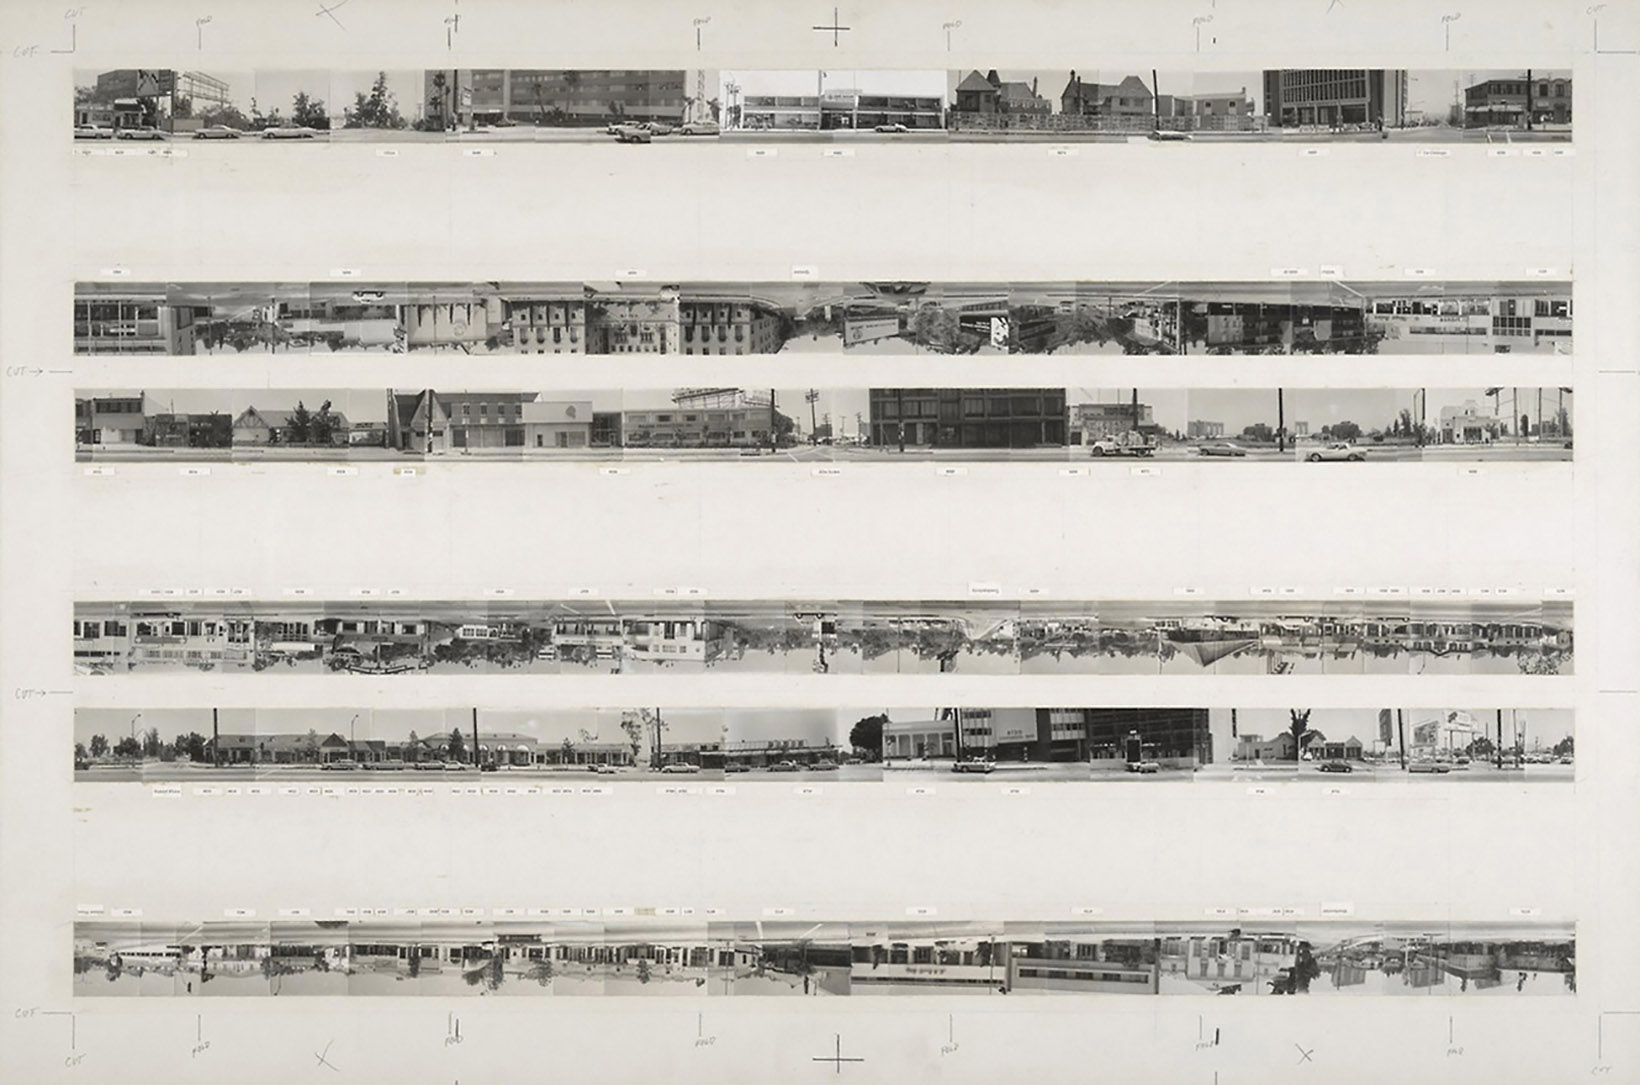
Edward Ruscha - Every building on sunset strip
The artist book unfolds to 25 feet (8.33 meters) and shows continuous photographic views of both sides of a 1.5 mile section of Sunset Boulevard using analogue photography.
If 'Every Building on Sunset Strip' was the analogue way of the 60’s to document a street in its entirety, what would today’s equivalent be considering the data available for documentation?
Iconic Broadway was an obvious choice, slicing through Manhattan in a linear, representative way. The ‘On Broadway’ project only examines data created along this linear path to create and tell new ‘data stories’ on the diversity of New York City’s neighborhoods and people.
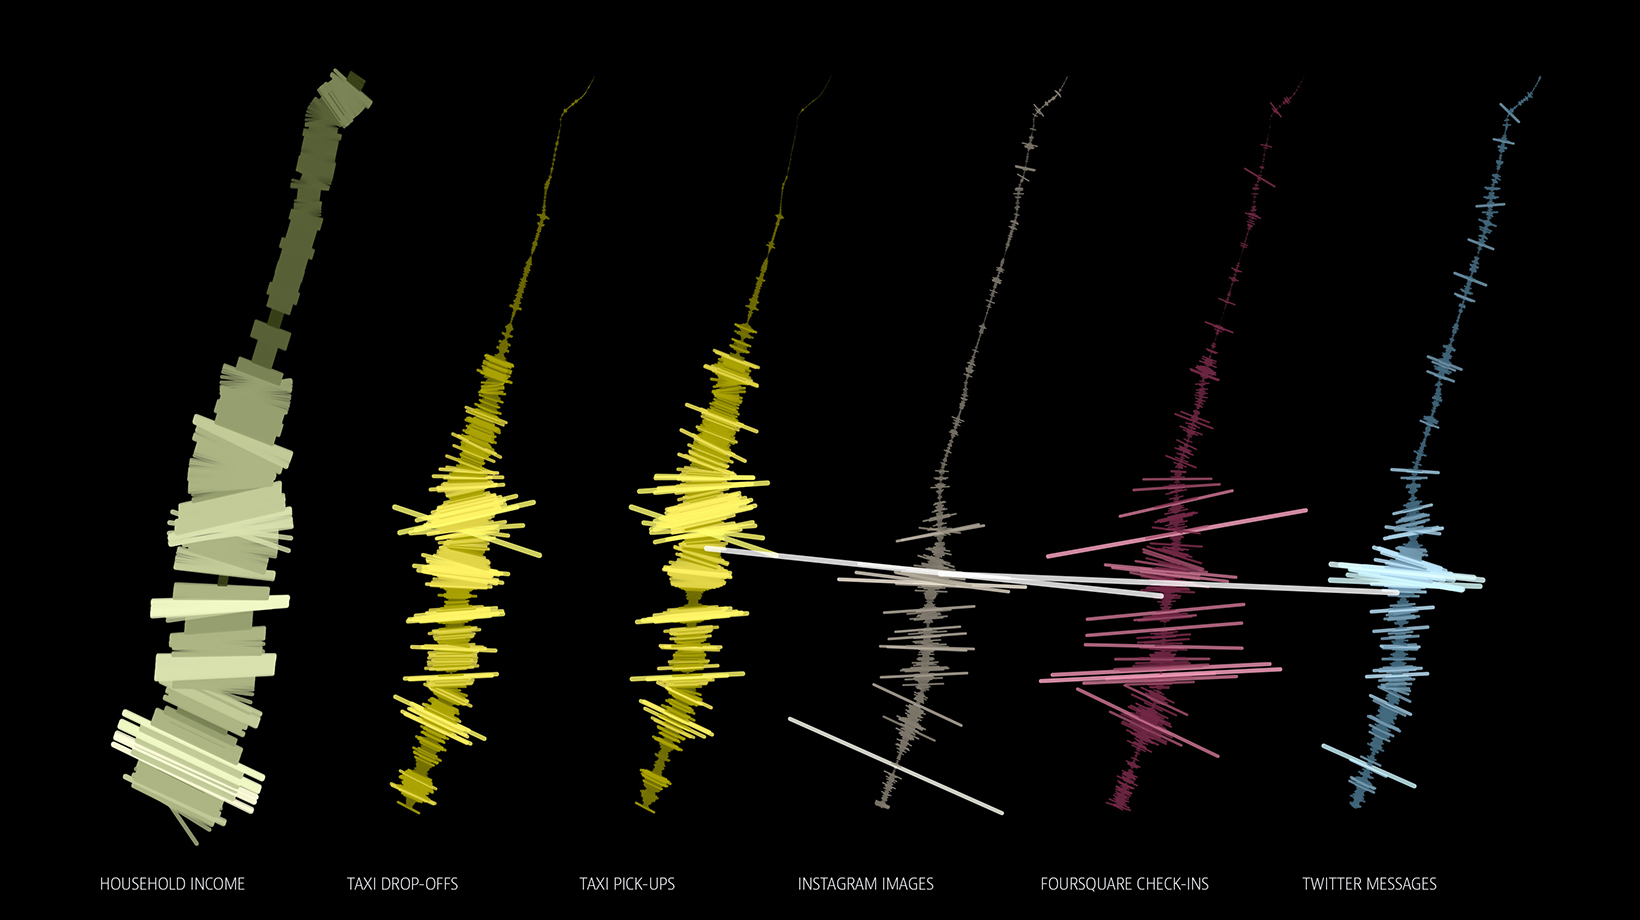
Different Data Spines along Broadway
Through a visually rich and image-centric interface, where no maps are used and numbers play only a secondary role, the project provides new interactive ways for exploring the data collected along this street.
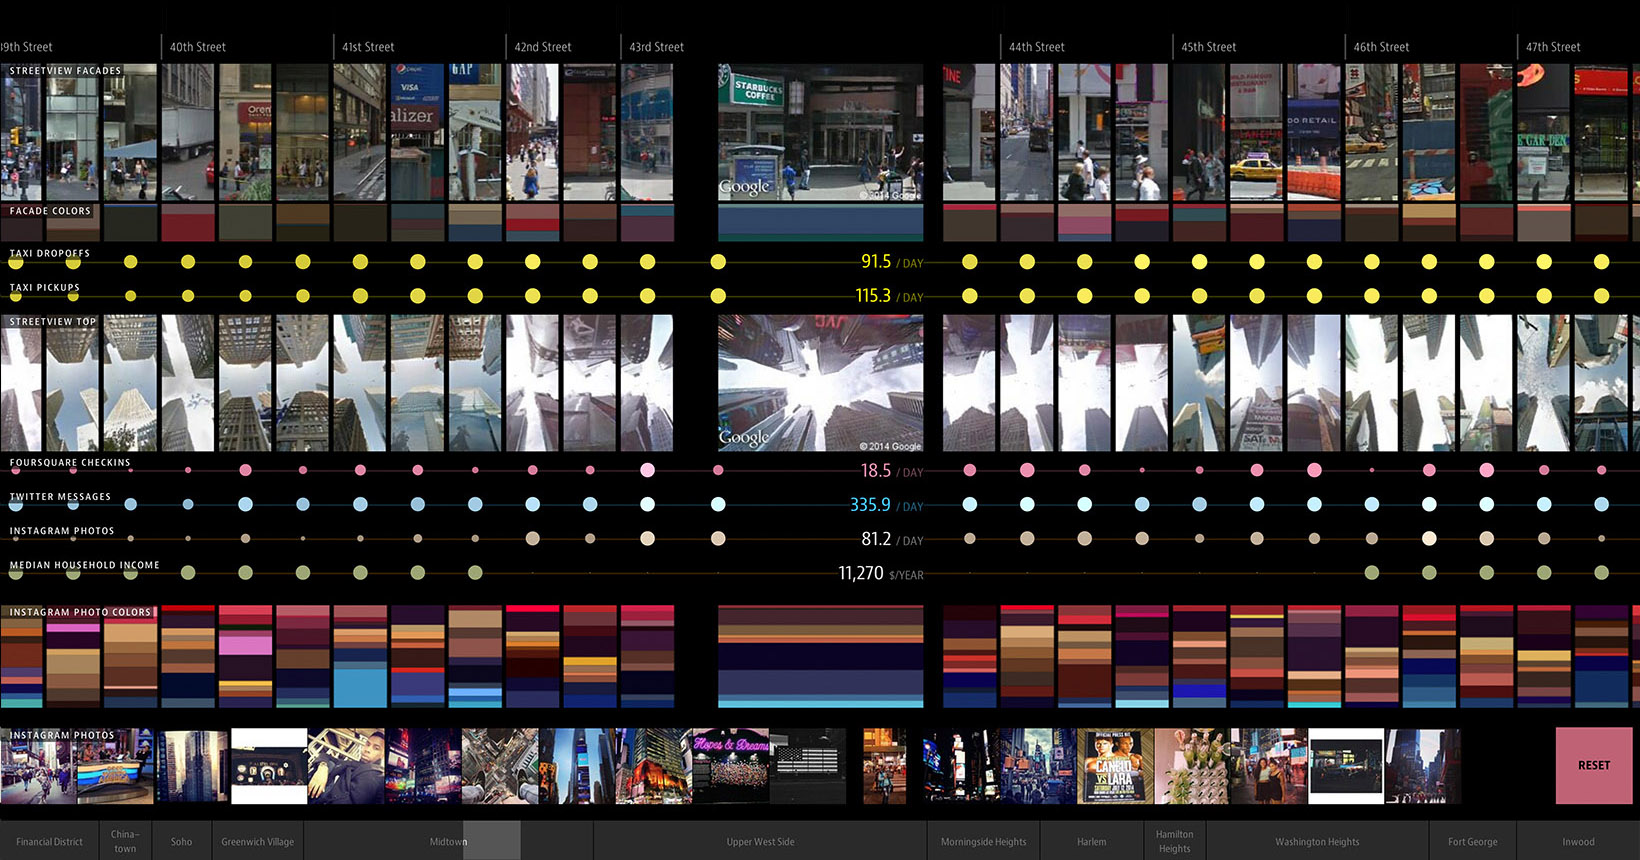
On Broadway Interface - Overview
It proposes a new visual metaphor for thinking about the city: a vertical stack of image and data layers juxtaposing the different data to highlight new connections, correlations and contexts.
Data sources include 660,000 Instagram photos shared during six months of 2014, Twitter posts featuring images for the same period, Foursquare check-ins, taxi pick-ups and drop-offs, as well as economic indicators.
By also including Google Streetview data, viewers are able to juxtapose the observable changes in the neighborhoods and their facades with the digital traces created by users of social networks in the same locations.
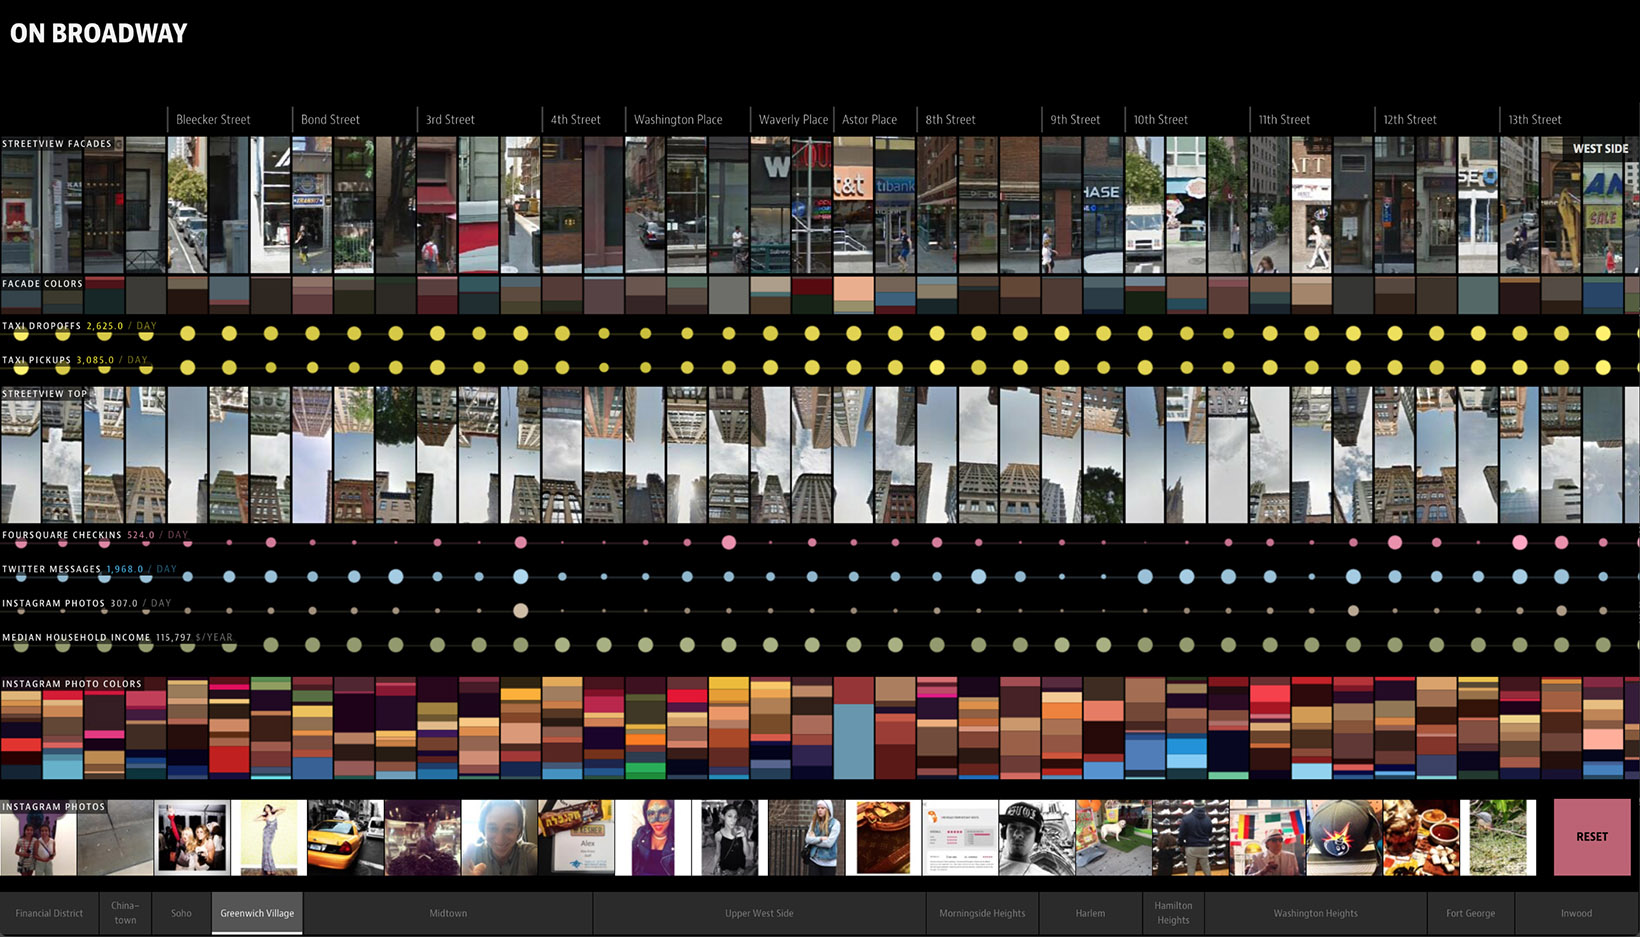
Greenwich Village
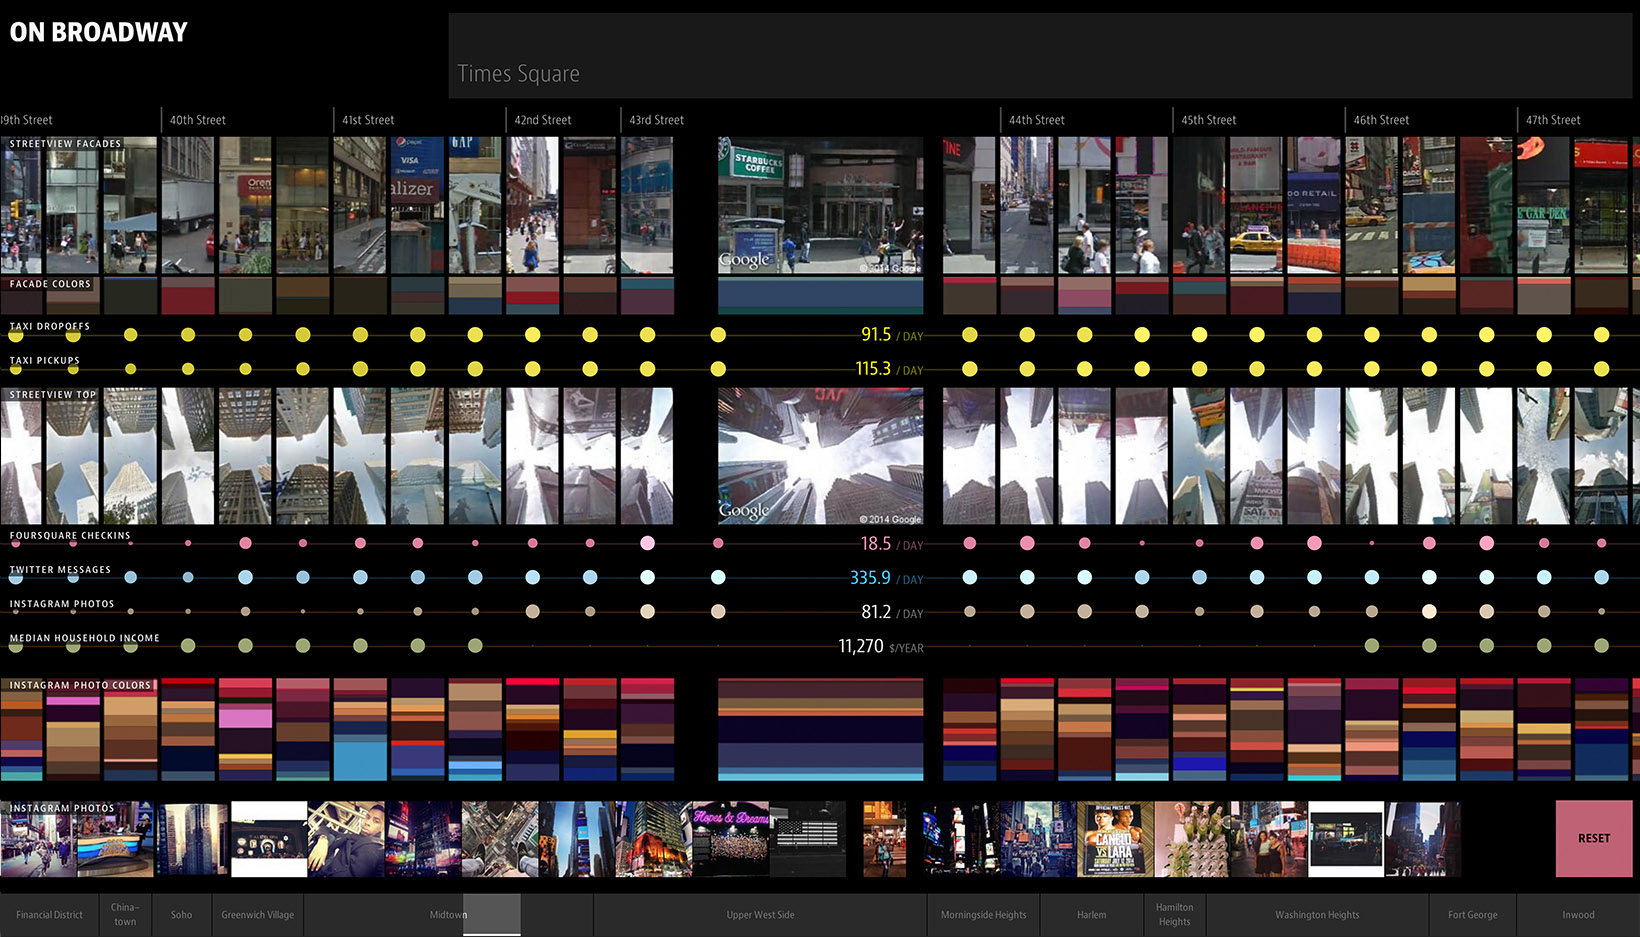
Midtown
To add a further layer of emotional expression and feeling ‘in the moment,’ viewers can include the original Instagram images to gain a richer, qualitative impression of a given area as captured by people taking photographs in this particular spot.
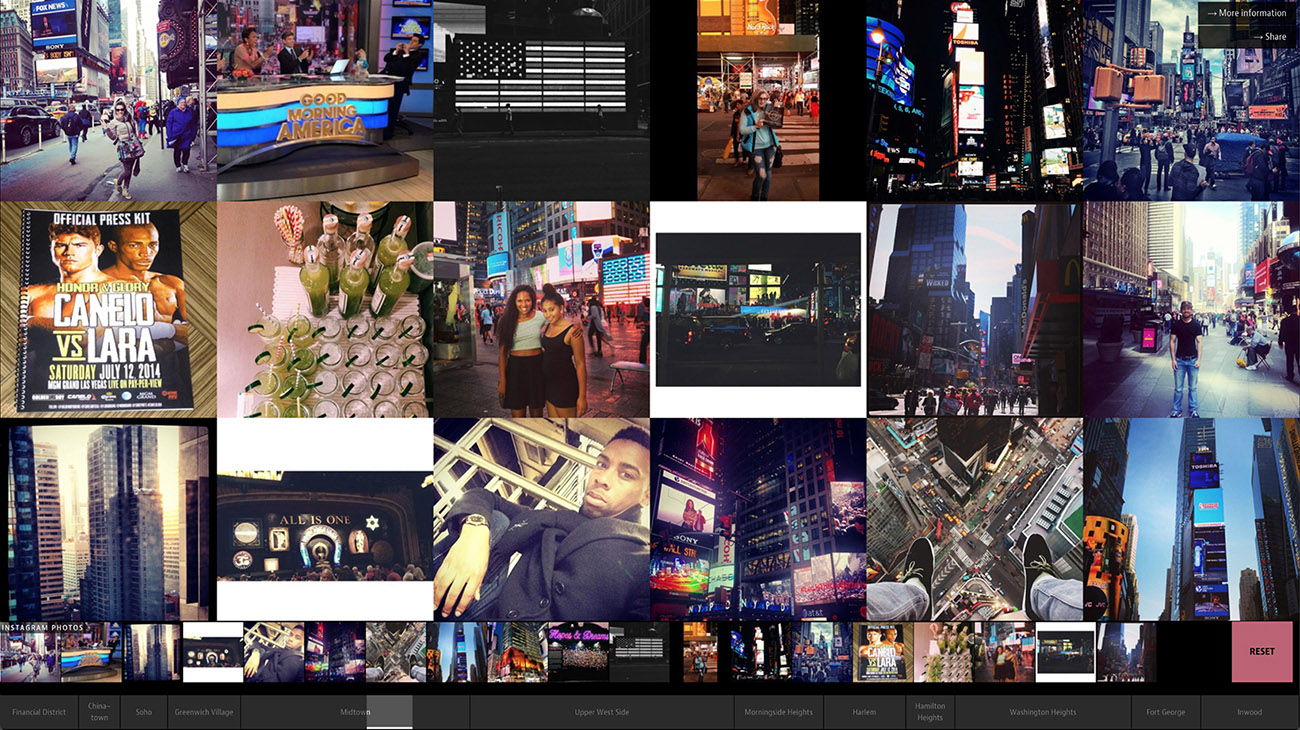
Instagram Overlay
Furthermore, the interface provides additional insights into the correlations between social media use and economic factors by incorporating income and demographic data.
The result is a new type of city view, one created from the activities of hundreds of thousands of people, that encourages interactive explorations of the diversity of Manhattan’s neighborhoods.
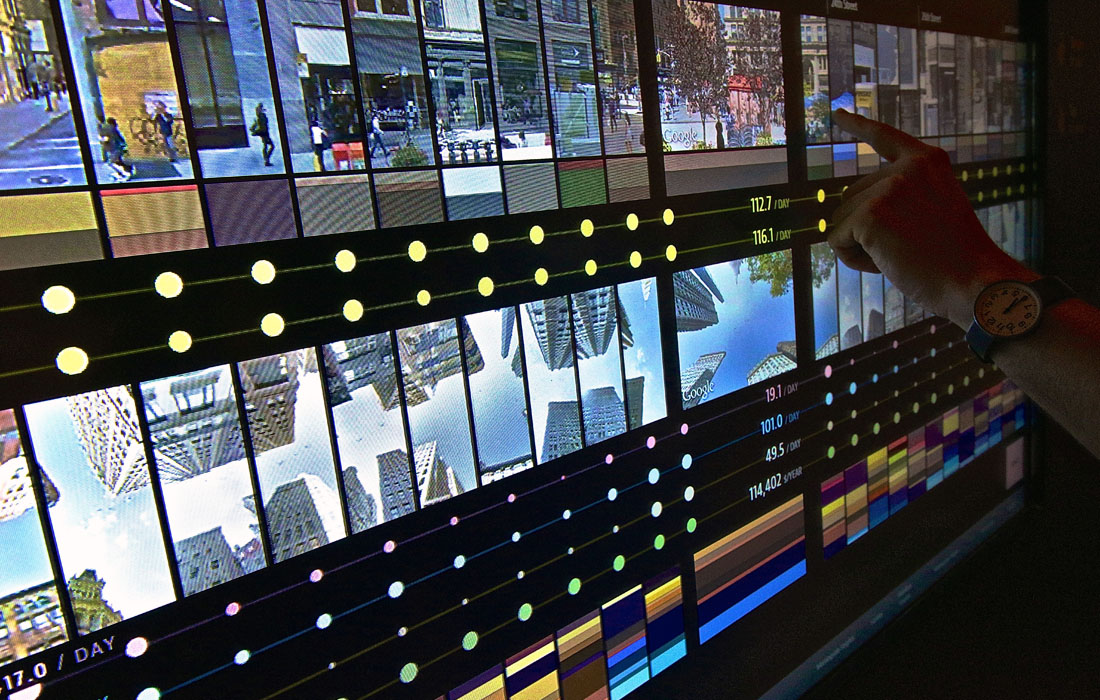
The touchscreen interface
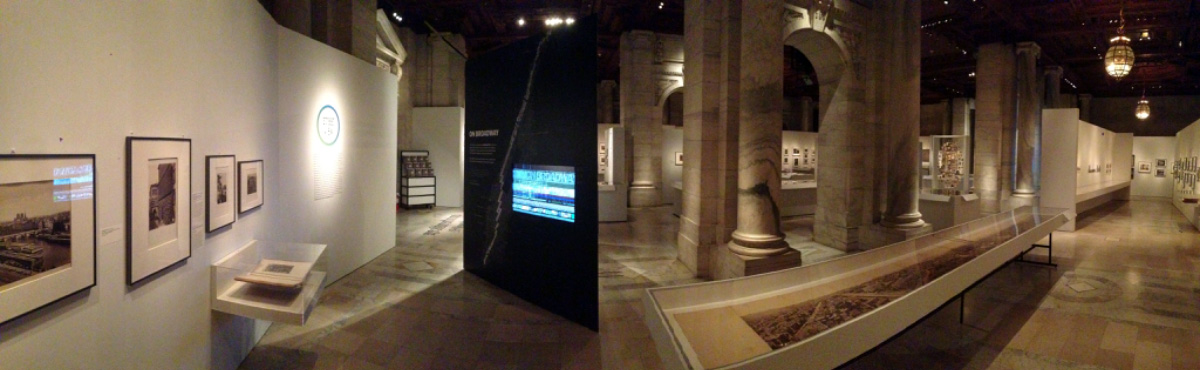
The ‘On Broadway’ installation exhibited at the ‘In the Public Eye’ exhibition - New York Public Library
Thus, 'On Broadway' creates a new type of city portrait that represents life in the 21st century city through a compilation of images and data collected along the 13 miles of Broadway, traversing Manhattan top to bottom.